Home » Planning Topics » Environment » Climate Action Planning » Measuring Progress » Transportation and Land Use
Transportation and Land Use
2023 METRICS
METRIC 6
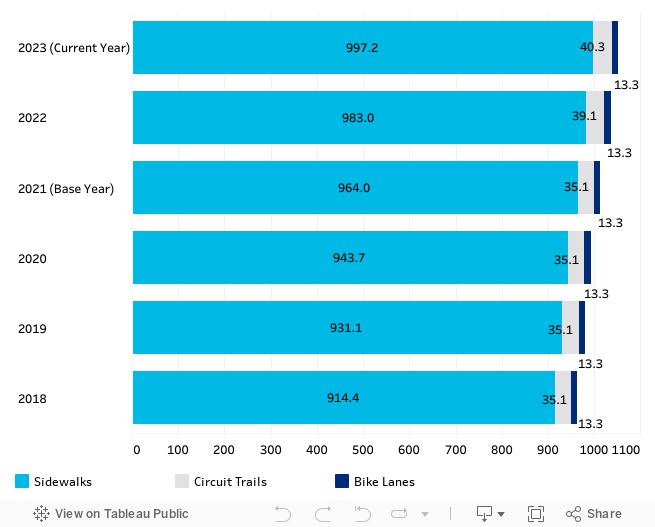
Sidewalks, trails, and bike lanes
Percent increase in multi-use trail, sidewalk, and bike lane mileage in the county.
Building out an interconnected network of multi-use trails, sidewalks and bike lanes provides a viable alternative to the personal vehicle for local trips. The stronger this network is, the more likely it is to be used, which will reduce transportation-related greenhouse gas emissions.
Sidewalks, trails, and bike lanes (miles)
This metric coordinates with Landscape3 metric 15.
Data source: Chester County Planning Commission data.
3.8%
Increase in miles of sidewalks, trails, and bike lanes
SINCE BASE YEAR 2021
Steady sidewalk growth
Most growth in the sidewalk network results from new development. The county and municipalities are proactively advancing development of the Circuit Trail Network and bike lane infrastructure, but progress is slow.
METRIC 7
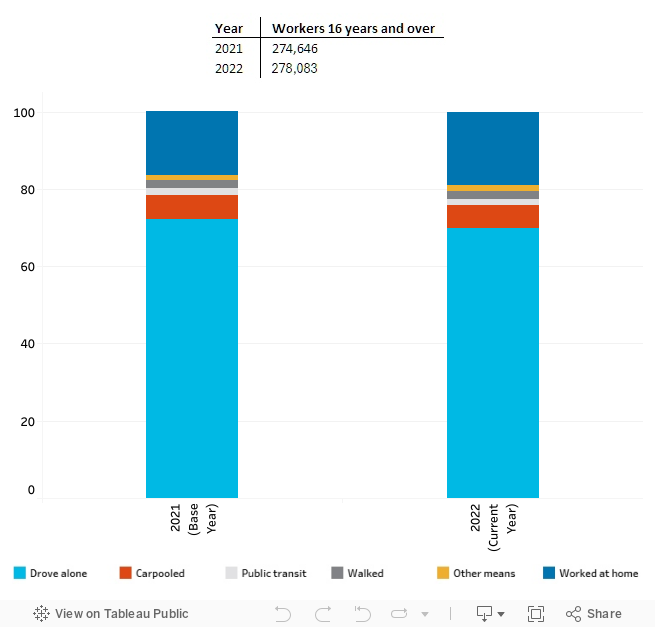
Transportation to work
Percentage of residents using means other than single-occupant vehicles for transportation to work.
Driving alone in a car with an internal combustion engine is the most carbon-intensive way to travel from a per-person standpoint (aside from flying!). Carpooling, traveling by bike, bus, or train reduces emissions associated with commuting.
Means to work for Chester County residents
Data source: Census/American Community Survey.
3.3%
Decrease in single occupancy vehicle commutes
SINCE BASE YEAR 2021
Fewer single occupancy vehicles
The increase in working from home resulted in fewer workers driving alone to work.
METRIC 8
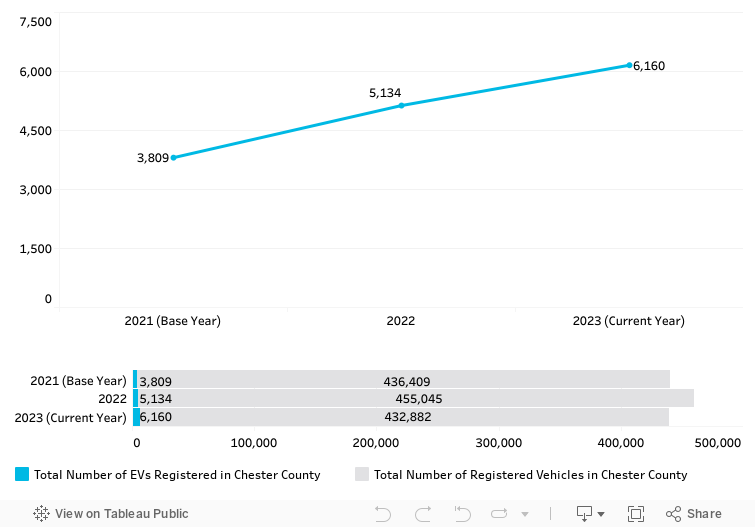
Electric vehicles
Number of electric vehicles county-wide.
According to the US Department of Energy's Alternative Fuels Data Center, electric vehicles driven in Pennsylvania generate only 18% of the carbon emissions that internal combustion engine (ICE) vehicles produce on an annual basis, far outweighing the slight emissions advantage ICE vehicles have over electric related to the vehicles' production and recycling.
EVs registered in Chester County
Data Source: Vehicle registration data from PennDOT.
62%
Increase in EV ownership
SINCE BASE YEAR 2021
On the rise
Although they make up only 1% of all vehicles registered in Chester County, in 2023 Chester County had the third highest number of registered electric vehicles in the state after Montgomery County and Allegheny County. Statewide EVs make up only 0.6% of all registered vehicles.
METRIC 9
Charging stations
Number of electric vehicle charging stations county-wide.
A robust and convenient network of public EV charging stations is needed to allow for a strong transition to electric vehicles, both by individuals and commercial fleets. Although most charging will happen at home or at work, public chargers help ease "range anxiety" and are important for those without access to chargers at home or at work.
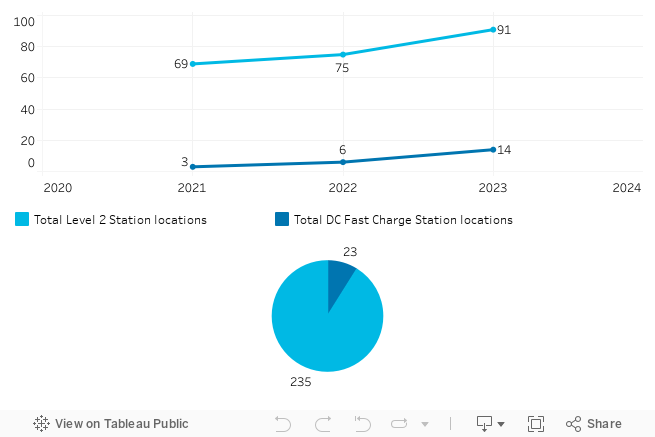
Public charging stations
Data source: US Department of Energy's Alternative Fuels Data Center data.
46%
Increase of new public charging stations
SINCE BASE YEAR 2021
Keeping pace with EV popularity
There has been steady increase in public EV charging station deployment, though most are in eastern Chester County. The number of DC fast charging stations is expected to rise significantly in the next few years when federally funded stations are constructed.
METRIC 10
County vehicles with low/no emissions
Percentage of county fleet that consists of low/no emissions vehicles.
Chester County has a goal of converting its government fleet vehicles to electric or other low/no emissions vehicles over time to reduce emissions associated with usage of county vehicles.
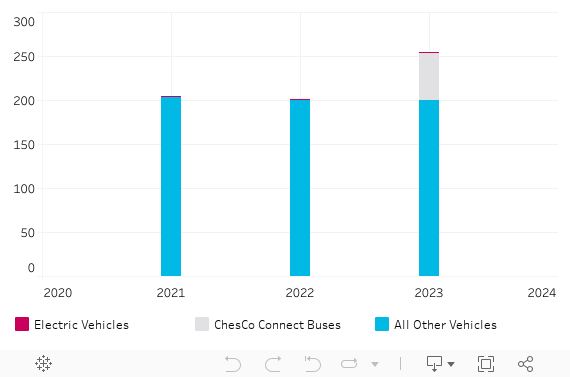
County vehicles with low/no emissions
Data source: Report from Chester County fleet manager.
0%
County fleet vehicles with low/no emissions
IN CURRENT YEAR 2023
Laying the groundwork
Chester County is hard at work developing charging stations to charge future fleet vehicles. The county's fleet of +/- 200 vehicles included 9 hybrid vehicles in 2023.
METRIC 11
Gasoline used by county vehicles
Annual gasoline usage by county fleet vehicles (gallons)
Chester County has a goal of converting government fleet vehicles to electric or other low/no emissions vehicles over time. Gasoline usage will go down as more internal combustion engine vehicles are replaced with electric or hybrid vehicles.
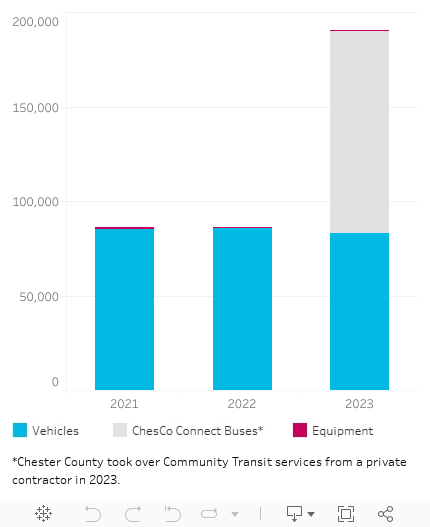
Gallons of fuel (gas and diesel) used for county fleet vehicles
3%
Decrease in gasoline usage by county fleet vehicles
Since base year 2021
Stable gas usage
Reduced numbers of fleet vehicles resulted in less gas usage, but vehicle operations remain consistent given the specific functions of the departments using the vehicles.
METRIC 12
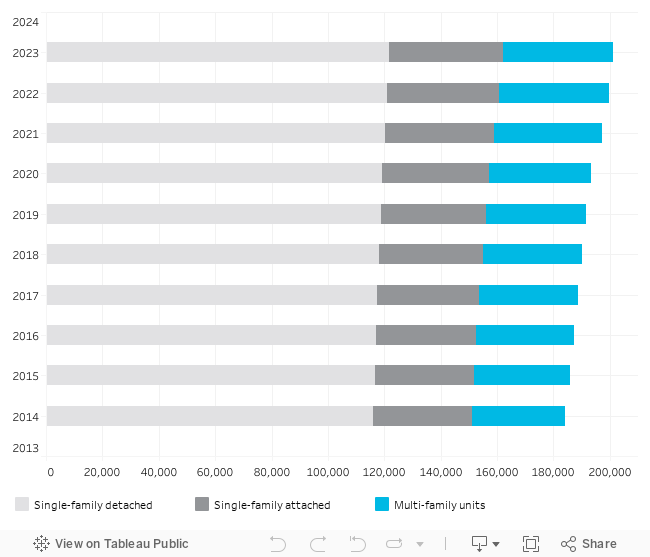
Multi-family housing
Percentage of new housing units that are attached or multi-family.
Attached and multi-family units are generally smaller than single family detached units, thereby requiring less energy for heating and cooling. Additionally, the shared walls of attached units that are not exposed to extreme outside temperatures also reduce heating and cooling requirements.
Type of housing units built
This metric coordinates with Landscape3 metric 9.
Data source: Chester County Planning Commission Housing Report.
63%
New housing units that are attached or multi-family
IN CURRENT YEAR 2023
A positive trend
Changes in housing demand have driven multifamily and attached unit development to outpace single family units.
METRIC 13
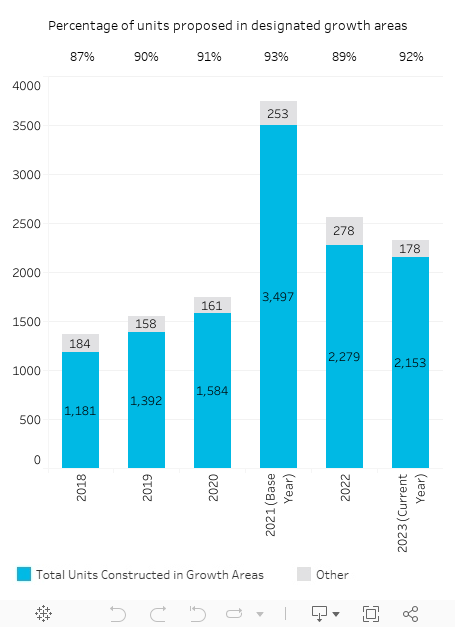
Housing in growth areas
Percentage of proposed residential lots/units in designated growth areas.
Rural and suburban landscapes in Chester County (and throughout the country) were designed around a culture of driving. Walking or biking for transportation purposes in these areas is often not feasible given the spread-out nature of destinations and lack of bicycle and pedestrian infrastructure on most roadways. By locating new housing units in existing urban centers and other growth areas where pedestrian and bicycle infrastructure could feasibly connect users to their desired destinations, more residents could reduce the reliance on personal vehicles and their associated emissions.
Proposed residential lots/units in designated growth areas
Data source: Chester County Planning Commission.
92%
New housing units that are in growth areas
IN CURRENT YEAR 2023
Smart growth policies work
Sound land use planning and policy has resulted in smart growth county-wide: 9 out of 10 new units are built within areas designed for future growth.
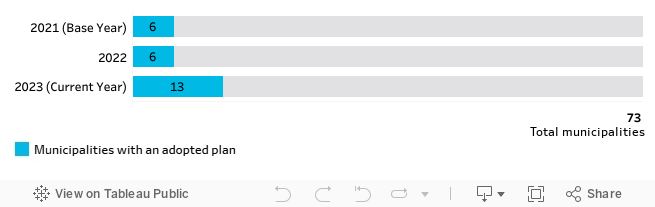
METRIC 14
Clean energy plans
Number of municipalities that have adopted a Clean Energy Transition plan or Climate Action Plan.
Tackling greenhouse gas emissions can seem like a monumental feat without a plan. Clean Energy Transition Plans and Climate Action Plans typically establish clear targets for greenhouse gas emissions reduction and a feasible action plan for reducing emissions associated with municipal government operations and often the community at large. Municipalities with such a plan are more likely to take a proactive approach toward reducing their own emissions and promoting beneficial practices in their communities like energy efficiency, composting, and stewardship of natural landscapes and soil.
Municipalities with an adopted plan
Data source: Chester County Planning Commission.
13
Municipalities in Chester County have an adopted plan
IN CURRENT YEAR 2023
Municipal climate action grows
More local governments are identifying climate solutions as priorities.